No-Code Data Access: AI Query Tools for Analysts
Table of Contents
- Introduction: No-Code Data Access Without the Wait
- How Natural Language SQL Tools Turn Questions Into Database Queries
- Why Business Analyst SQL Still Matters
- Comparing AI Tools Business Analysts Can Use for Data Analysis
- How to Choose BA Query Tools for Database Reporting
- A Safe First Rollout for No-Code Data Access
- Ask Better Questions for More Accurate AI Data Analysis
- Four Everyday Business Examples
- Common AI Data Analysis Pitfalls and Verification Checklist
- Conclusion: Make Database Reporting Easier, Not Blind
- Introduction: No-Code Data Access Without the Wait
- How Natural Language SQL Tools Turn Questions Into Database Queries
- Why Business Analyst SQL Still Matters
- Comparing AI Tools Business Analysts Can Use for Data Analysis
- How to Choose BA Query Tools for Database Reporting
- A Safe First Rollout for No-Code Data Access
- Ask Better Questions for More Accurate AI Data Analysis
- Four Everyday Business Examples
- Common AI Data Analysis Pitfalls and Verification Checklist
- Conclusion: Make Database Reporting Easier, Not Blind
Introduction: No-Code Data Access Without the Wait
AI query tools turn business analysts’ plain-language questions into database queries, charts, and reports. Marketing managers can ask for campaign revenue by region; IT managers can find unused software licenses. Neither needs advanced business analyst SQL skills.
TL;DR: No-code data access speeds reporting, but analysts must verify database definitions, relationships, access rules, dates, metrics, and tables because AI tools can produce convincing but incorrect answers.
This guide covers:
- How no-code data access works behind the interface
- Why basic business analyst SQL knowledge still helps
- How to compare and introduce BA query tools safely
- How to turn a one-time question into a repeatable report
How Natural Language SQL Tools Turn Questions Into Database Queries
A relational database stores information in tables, where rows usually represent items such as orders or customers and columns describe their dates, values, or locations. Identifiers connect related tables; for example, an order’s customer ID may point to a customer record.
Most BA query tools work similarly:
-
You ask a question. For example: Show monthly revenue from new customers in Germany during 2025.
-
The tool reads metadata: table names, column descriptions, defined metrics, and permitted relationships.
-
It interprets business language. The tool must decide what revenue, new customer, and Germany mean in this database.
-
It creates a query. Text-to-SQL products may generate SQL; other tools create DAX, LookML-based logic, or visual-query-builder instructions.
-
The database returns records, which may appear as a table, chart, explanation, saved query, or scheduled report.
A no-code interface still runs a database query. Good no-code data access hides syntax, not the calculation’s meaning.
Why Business Analyst SQL Still Matters
Business analyst SQL requires no years of database administration experience; basic knowledge helps identify wrong AI-generated answers.
Real company databases are harder than tutorial examples. The 2024 Spider 2.0 research tested 632 enterprise text-to-SQL tasks on databases often containing more than 1,000 columns. Its o1-preview-based agent solved only 17% of those tasks versus 91.2% on the simpler Spider 1.0 benchmark. Models have since improved, but the result shows how complicated schemas create many ways to misunderstand questions.
Learn enough business analyst SQL to recognize:
- Selection: which columns the query returns
- Filters: which dates, regions, statuses, or customer groups it includes
- Aggregation: whether it uses a sum, count, average, or distinct count
- Joins: how orders, customers, campaigns, or products are connected
- Grain: whether one row represents an order, line item, customer, or month
You need not write every query; read the tool’s interpretation and ask sensible questions.
Comparing AI Tools Business Analysts Can Use for Data Analysis
The best AI data analysis category depends on where the company stores metrics and reports. A separate assistant can add work when the existing BI platform already offers natural-language analysis.
| Approach | Best Fit | Typical Output | Main Limitation |
|---|---|---|---|
| Conversational BI, such as Power BI, Looker, or Tableau | Teams with established BI models | Charts, summaries, calculations, and report content | Quality depends on the prepared semantic model |
| Visual query builders, such as Metabase | Users preferring visible filters and steps | Interactive questions, charts, dashboards, and SQL previews | Complex analysis may require SQL |
| Dedicated text-to-SQL products | Teams querying several databases | Generated SQL, results, explanations, and exports | Requires careful schema context and query review |
| General AI chat assistants | Learning, query drafting, or sample-data work | SQL suggestions and explanations | Copying private schema or data may violate policy |
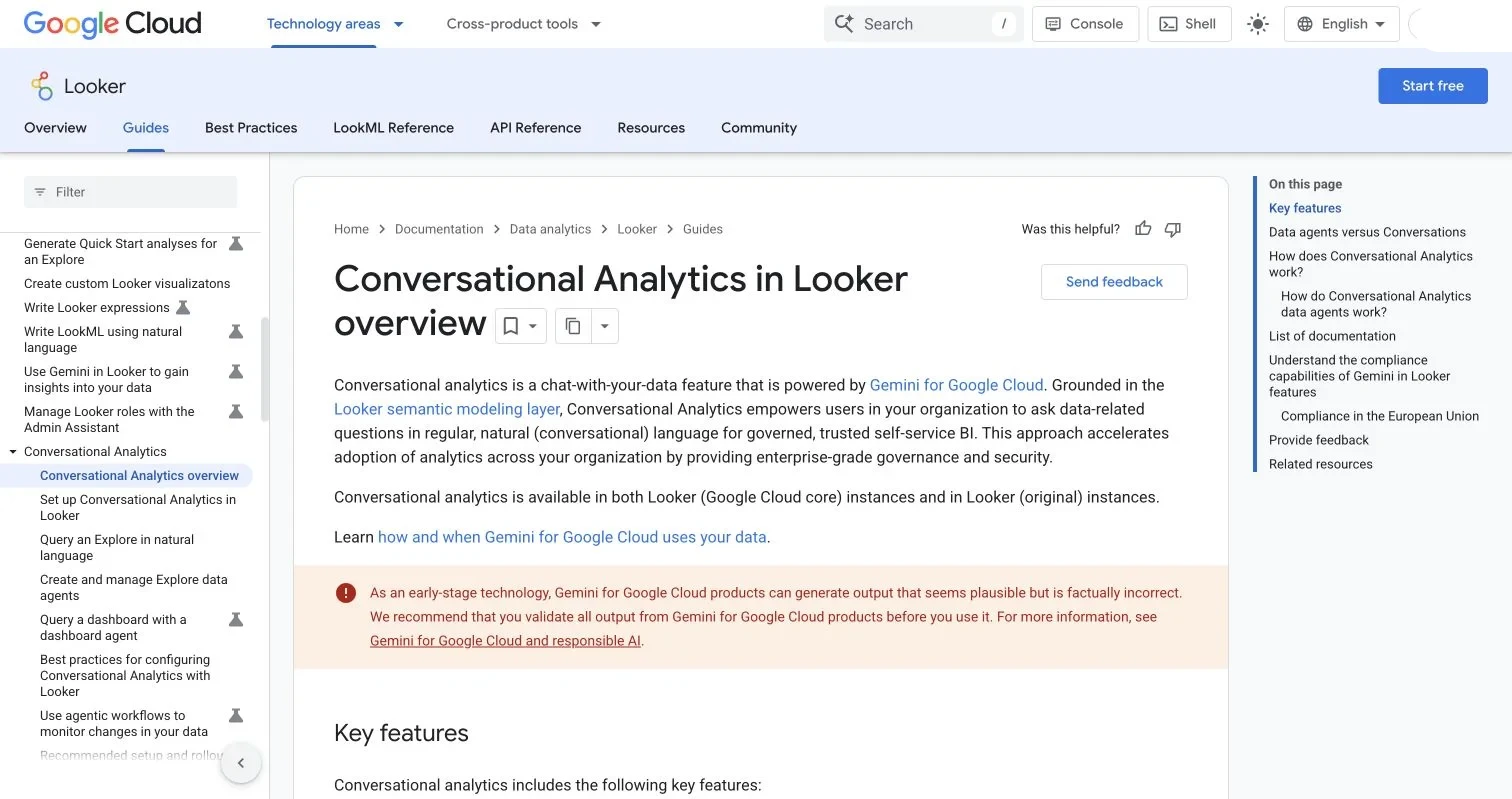
Power BI Copilot can generate visuals and ad hoc DAX calculations from a semantic model, but Microsoft says this experience does not currently handle forecasting or anomaly detection. Looker Conversational Analytics grounds questions in LookML definitions and can query up to five Looks through a data agent. Tableau Agent creates visualizations conversationally within the normal Tableau interface.
Looker’s official documentation shows how conversational questions are grounded in a semantic model, an important distinction between governed BI and unrestricted query generation.
For a more transparent bridge between no-code data access and SQL, the Metabase query builder shows filters, joins, summaries, and the native query before running it. DBSilk’s text-to-SQL tool directory lists dedicated products to compare.
How to Choose BA Query Tools for Database Reporting
Vendors usually demo BA query tools on tidy datasets. Evaluate them on your own data’s awkward parts: unclear names, duplicate records, fiscal calendars, regional restrictions, and metrics calculated differently across departments.
| Item | What to Check | Why It Matters |
|---|---|---|
| Database support | Database and SQL-dialect connectors | Generated PostgreSQL may fail on SQL Server or BigQuery |
| Business definitions | Metrics, synonyms, descriptions, and approved joins | Tells the tool what revenue or active customer means |
| Permissions | Read-only roles, row controls, and column masking | Limits users to permitted data |
| Transparency | Visible fields, filters, SQL, or calculation steps | Lets reviewers inspect surprising answers |
| Report workflow | Saving, sharing, exporting, scheduling, and alerts | Makes useful queries repeatable |
| Administration | Audit logs, usage limits, and model settings | IT needs to investigate access and manage cost |
I favor a slightly less conversational product that shows its work over a fluent assistant returning unexplained numbers. In business reporting, traceability beats charm.
A Safe First Rollout for No-Code Data Access
Start with one bounded problem, not the full warehouse. Campaign reporting, sales pipeline reviews, and support-volume analysis work well because teams know the expected totals.
-
Select one dataset. Use a selected model with a clear owner, not dozens of raw operational tables.
-
Write the metric definitions. Document company calculations and exclusions for revenue, conversion, churn, refunds, and reporting periods.
-
Create restricted access. Use a read-only database role. Apply row-level security and mask personal or financial fields before they reach the AI layer.
-
Prepare reference questions. Test 15 to 20 analyst-verified questions, including ambiguous wording and follow-ups.
-
Run a small pilot. Have several business users complete normal reporting tasks. Track answer accuracy, median completion time, correction rate, and analyst escalations.
-
Approve repeatable reports. Save each correct query’s metric definition, filters, owner, and refresh schedule. Do not regenerate important reports from fresh weekly prompts.
This makes no-code data access a managed database reporting path, not an uncontrolled experiment.
Ask Better Questions for More Accurate AI Data Analysis
AI tools respond better to concrete requests than broad questions. Why are sales bad? leaves the system to choose the metric, period, comparison, and cause. The answer may sound confident despite scant direction.
Build questions from:
| Part | Example |
|---|---|
| Metric | Net revenue after refunds |
| Population | First-time online customers in Germany |
| Period | January through June 2026 |
| Grouping | Month and acquisition channel |
| Comparison | Same months in 2025 |
| Output | Table plus a line chart |
A stronger prompt: Show monthly net revenue after refunds for first-time online customers in Germany from January through June 2026. Compare it with the same period in 2025 and group it by acquisition channel.
Inspect which date field, refund rule, customer identifier, and currency conversion the tool used. Narrow the result with follow-ups: Exclude internal test accounts or Use the finance team’s recognized-revenue metric. Basic business analyst SQL thinking improves this no-code workflow.
Four Everyday Business Examples
These examples show where BA query tools can remove routine reporting work without treating every business question as simple.
-
Marketing campaign review: Request qualified leads, customer acquisitions, and recognized revenue by campaign for the previous 90 days, with a 30-day attribution window and test leads excluded. Before saving, compare totals with the approved marketing dashboard.
-
Sales pipeline check: Request open opportunities inactive for 14 days, grouped by owner and expected close month. Confirm whether activity includes email, calls, meetings, or any CRM update. This can become a weekly manager report linking to each opportunity.
-
Customer support analysis: Find the ten issue categories with the largest ticket-volume increase over the last eight weeks. Request ticket and distinct-customer counts so one noisy customer does not distort results. Verify consistent treatment of merged and deleted tickets.
-
IT license review: List paid software accounts with no login in the past 60 days, grouped by department and subscription plan. Join login events to the employee directory, excluding approved service accounts and people on leave. Use the output for license review, but require manager approval for cancellations.
These examples turn clear operational questions into checkable results, the sweet spot for AI tools business analysts can use today.
Common AI Data Analysis Pitfalls and Verification Checklist
Most failures stem from business ambiguity or weak data preparation, not invalid SQL. A flawless query can still answer the wrong question.
| Risk | What to Check | Practical Fix |
|---|---|---|
| Ambiguous metric | Does sales mean bookings, invoices, or collected cash? | Use a written, approved metric |
| Duplicate joins | Did joining line items multiply order totals? | Compare row counts and distinct order IDs before and after joining |
| Wrong date | Is the query using order, shipment, invoice, or payment date? | Name the required date in the prompt |
| Hidden filter | Were cancelled orders or internal users included? | Display all filters beside the result |
| Stale data | When did each source last refresh? | Show refresh timestamps on reports |
| Sensitive output | Does the result expose personal or restricted fields? | Apply database permissions and masking before tool access |
Direct answers:
Conclusion: Make Database Reporting Easier, Not Blind
AI query tools can move business analysts from questions to useful reports faster. The best systems pair plain-language input with clear metric definitions, restricted database access, and visible query logic.
The practical path:
- Begin with a selected dataset and a narrow reporting problem
- Learn enough business analyst SQL to inspect filters, joins, and totals
- Test BA query tools against verified questions from your own company
- Save approved reports and monitor their refresh dates
No-code data access should let more people safely examine company information without removing judgment. Choose one recurring question, document the expected answer, and test a tool against it. That exercise reveals more than an impressive demo.
Frequently Asked Questions
Can AI replace SQL for a business analyst?
It reduces manual SQL work, but complex joins, metric disputes, and important decisions still require review.
Should non-technical users query a production database?
They can use a governed read-only model; direct access to raw transactional tables is a poor starting point.
Can the tool modify records?
A first rollout should prohibit writes; updates or deletions need separate, reviewed workflows.
Treat each first-time query as a draft. Once validated, reuse it rather than repeatedly asking the system to reinterpret the same requirement.
Do business analysts still need SQL when using AI query tools?
They do not need advanced SQL skills, but basic knowledge helps them review filters, joins, aggregations, and row-level detail. This makes it easier to recognize results that are technically valid but based on the wrong business interpretation.
How should a company choose an AI query tool?
Test candidates against the company’s actual databases, metric definitions, permissions, and reporting workflows. Prioritize tools that expose their fields, filters, calculations, or generated SQL so analysts can investigate unexpected results.
What is the safest way to introduce no-code data access?
Begin with a governed dataset, a narrow reporting use case, and read-only access. Validate the tool with analyst-approved questions before expanding access, and apply row-level security and data masking at the database or semantic-model level.
How can users ask questions that produce more accurate results?
Specify the metric, population, reporting period, grouping, comparison, and desired output. Also name important rules such as the relevant date field, refund treatment, attribution window, exclusions, or currency conversion method.
How can analysts verify an AI-generated answer?
Check the metric definition, date field, filters, joins, row grain, and source refresh time. Compare important totals with an approved dashboard or known reference result, especially when joins could create duplicate records.
Should AI query tools connect directly to production databases?
Users should generally work through a curated, read-only model rather than unrestricted raw transactional tables. Database permissions, column masking, and row-level controls should limit what the AI layer can retrieve before any query is submitted.
When should an AI-generated query become a saved report?
Save it after an analyst confirms the definitions, filters, totals, owner, and refresh schedule. Reusing the validated query prevents the tool from interpreting the same business requirement differently each time the report is needed.
Related Articles
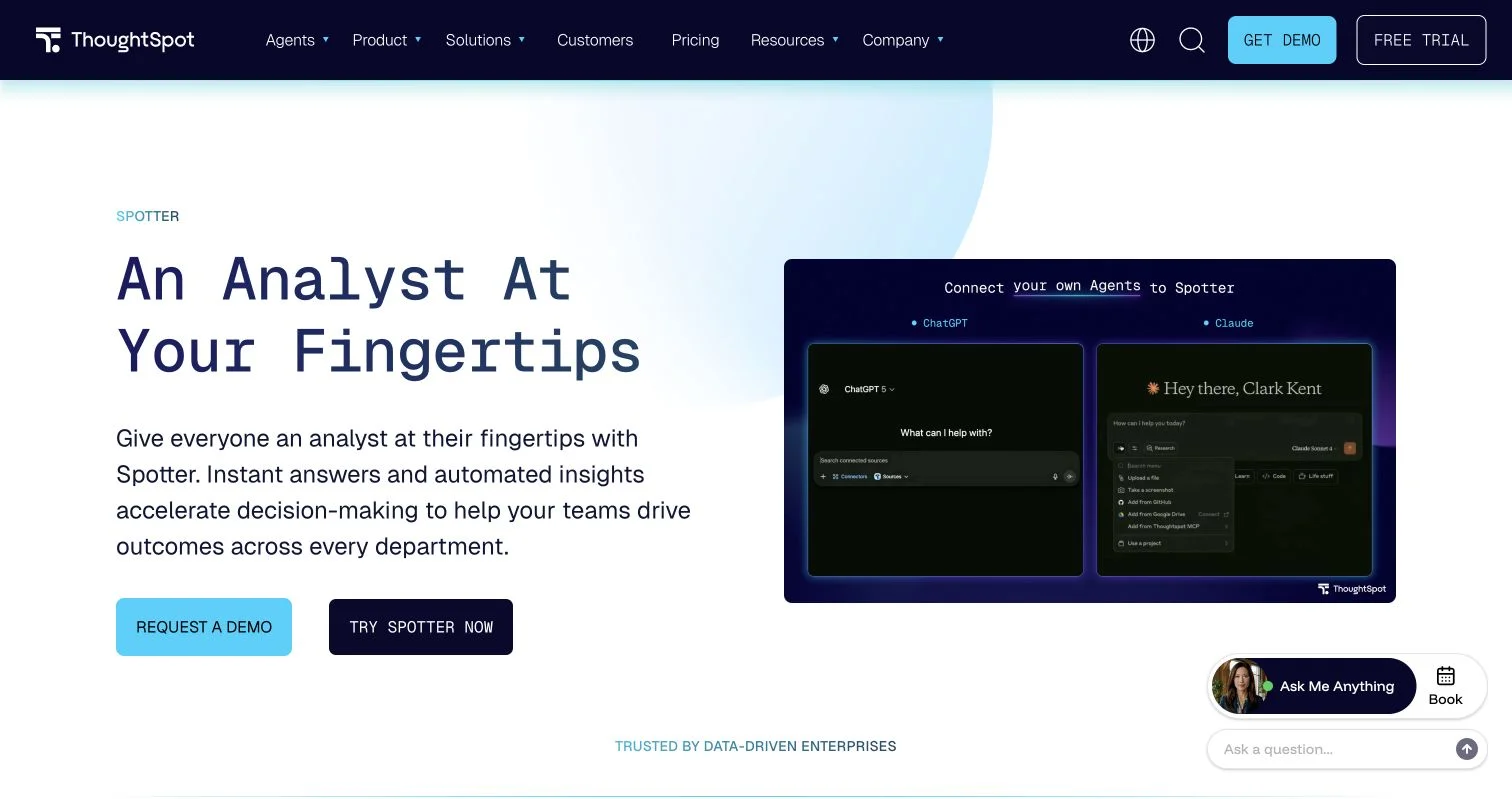
Data Analyst SQL Tools for Self-Service Analytics
Compare AI SQL tools, improve text-to-SQL prompts, verify queries, secure database access, and create reliable data visualizations.
Schema Context for Text-to-SQL: A Practical Guide
Learn how schema context, metadata enrichment, and focused retrieval improve text-to-SQL accuracy, security, and business reliability.
AI Hallucination in SQL: Risks, Validation & Guardrails
Learn why AI-generated SQL fails silently and how schema checks, result validation, read-only access, testing, and guardrails prevent costly errors.