Data Analyst SQL Tools for Self-Service Analytics
Table of Contents
- Why data analyst SQL tools matter for self-service analytics
- What AI analyst tools and text-to-SQL systems actually do
- SQL for analysts: how a database question becomes an answer
- Comparing five data analyst SQL tools for self-service analytics
- First steps for implementing text-to-SQL and AI analyst tools
- Better prompts for SQL for analysts and SQL query generator tools
- From text-to-SQL to AI data visualization: four examples
- Checking accuracy, privacy, and database access
- Common problems and a practical pilot scorecard
- Choosing AI analyst tools for your first data project
- Why data analyst SQL tools matter for self-service analytics
- What AI analyst tools and text-to-SQL systems actually do
- SQL for analysts: how a database question becomes an answer
- Comparing five data analyst SQL tools for self-service analytics
- First steps for implementing text-to-SQL and AI analyst tools
- Better prompts for SQL for analysts and SQL query generator tools
- From text-to-SQL to AI data visualization: four examples
- Checking accuracy, privacy, and database access
- Common problems and a practical pilot scorecard
- Choosing AI analyst tools for your first data project
Why data analyst SQL tools matter for self-service analytics
Data analyst SQL tools let marketing and IT teams describe questions in plain language, inspect AI-generated SQL, and chart the results. This eases the first steps without replacing database knowledge.
AI can write SQL; the real question is whether it uses the right tables, definitions, dates, and filters.
- How AI analyst tools turn questions into database queries
- Which query tools analysts can use for self-service analytics
- How to check AI-generated SQL before trusting a result
- How to turn query results into clear visualizations
TL;DR: A practical self-service workflow answers routine questions without giving AI uncontrolled access to company data.
What AI analyst tools and text-to-SQL systems actually do
Most AI analyst tools pair a language model with a database schema describing tables, columns, data types, and relationships. More capable tools also receive metric definitions, field descriptions, approved examples, and access rules.
For monthly revenue by customer type, the tool may:
- Find tables related to orders, customers, and payments
- Use a SQL query generator to translate the request into SQL
- Run the SQL with the user’s database permissions
- Display the rows as a table or AI data visualization
- Explain or revise the result after a follow-up question
This is text-to-SQL. Some products show the SQL; others use a governed semantic layer. A semantic layer defines revenue, active customers, qualified leads, and other agreed metrics.
A general chatbot may write valid SQL without knowing your company excludes refunded orders from revenue. Connected tools can use database metadata and business definitions only when that context is prepared.
Treat AI-generated SQL as a draft. It reduces repetitive typing and explains unfamiliar code, but requires human review before informing campaigns, budgets, or operations.
SQL for analysts: how a database question becomes an answer
A relational database stores records in tables: rows are records, and columns are attributes. An orders table might contain one row per order, with customer ID, date, status, and amount columns. A customer ID can join it to a customers table.
Analysts usually begin with these SQL operations:
| SQL operation | Plain-language purpose | Example use |
|---|---|---|
SELECT |
Choose fields or calculations | Return campaign name and revenue |
WHERE |
Filter records | Keep completed orders from June |
GROUP BY |
Combine records into categories | Calculate revenue by channel |
JOIN |
Connect related tables | Match orders with customer segments |
ORDER BY |
Sort the result | Put the highest revenue first |
An AI-assisted request follows:
- The analyst states a business question and the intended time period.
- The tool maps business words to tables, columns, and metrics.
- It creates SQL using the database’s dialect, such as PostgreSQL or BigQuery SQL.
- The database executes the query and returns matching rows.
- The tool proposes a table, chart, or written explanation.
Errors can occur at any step: the tool may choose created_at instead of paid_at, join duplicate records, or interpret last month as the previous 30 days. Understanding this workflow makes query tools easier to check.
Comparing five data analyst SQL tools for self-service analytics
Choose based on your data stack: a Power BI team has different needs from a small company seeking a self-hosted dashboard. This comparison focuses on query creation, self-service analytics, and visualization.
| Tool | Best fit | AI and visualization workflow | Point to check |
|---|---|---|---|
| Power BI Copilot | Organizations using Microsoft Fabric and Power BI | Answers data questions, generates DAX, and assists with reports and summaries | Requires paid Fabric F2 or higher or Power BI Premium P1 or higher; the semantic model should be prepared for AI |
| Tableau Agent | Teams with an established Tableau environment | Looks at a selected data source and creates or changes visualizations through conversation | Access depends on the Tableau edition, site settings, role, and supported data source |
| Hex AI | Analysts combining SQL, Python, notebooks, and data apps | Creates or edits SQL, Python, chart, pivot, and Markdown cells | More flexible than a simple BI tool, but users benefit from notebook and SQL knowledge |
| Metabase Metabot | Teams wanting accessible BI, dashboards, and a SQL editor | Creates charts, generates or edits SQL, explains visualizations, and attempts to fix query errors | Generated SQL should be inspected; chart-formatting and SQL-variable support have limitations |
| ThoughtSpot Spotter | Larger teams prioritizing governed natural-language exploration | Answers questions through a semantic layer and returns interactive visual results | Good answers depend on well-built models, metric definitions, permissions, and business context |
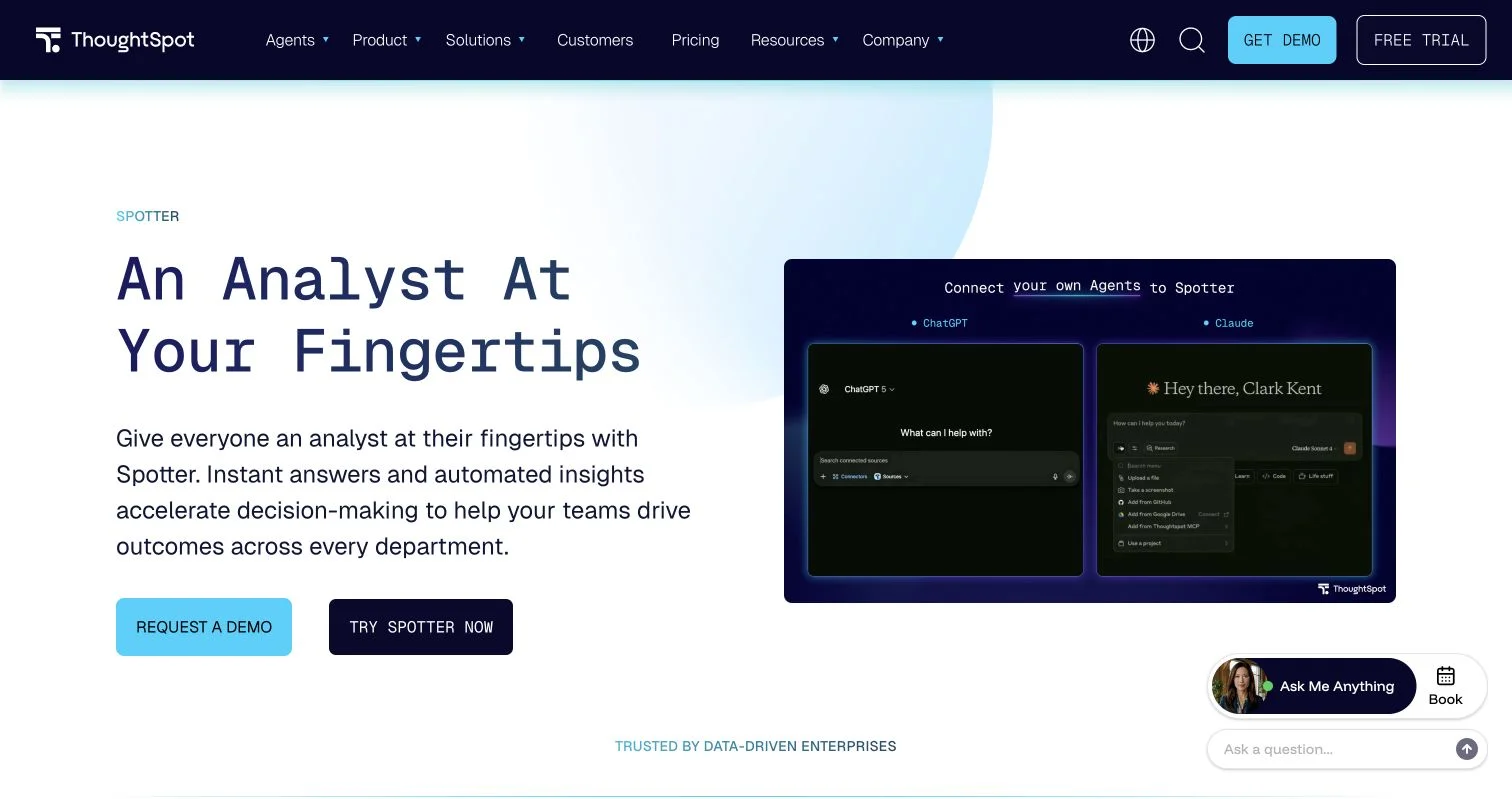
ThoughtSpot presents Spotter as an analytics agent that gives business teams instant answers and automated insights, illustrating the self-service experience these tools aim to provide.
A tool aligned with your permissions and metrics usually beats a longer feature list. Test products with messy real questions, not just sample data.
First steps for implementing text-to-SQL and AI analyst tools
Start with a narrow use case such as campaign reporting, support-ticket volume, or infrastructure capacity. This unglamorous work makes the tool useful.
-
Choose a safe data source. Connect to an analytics warehouse, read replica, or prepared dataset, not the production database, and grant read access only to required schemas.
-
Define the first metrics. Define debated terms such as revenue, conversion, active customer, and churn, including their source table, calculation, exclusions, time zone, and owner.
-
Describe the schema. Document unclear fields such as
amt_2, table relationships, and the date column for each metric. -
Create 20 to 30 test questions. Include totals, joins, time comparisons, missing values, and awkward wording, with the expected SQL or answer.
-
Run a small pilot. Five to ten users can expose vague prompts and missing definitions. Record wrong answers, confusing charts, and incomplete queries.
-
Publish approved work. Share reviewed queries and visualizations so users can adapt them instead of starting from scratch.
This makes AI analyst tools a practical route through governed data. Self-service analytics should speed routine answers without removing ownership or access controls.
Better prompts for SQL for analysts and SQL query generator tools
Good prompts specify the metric, population, time range, grouping, exclusions, and output. You need not know SQL vocabulary, but must define the number.
| Weak prompt | Better prompt | Why the revision helps |
|---|---|---|
| Show sales last month | Calculate net paid revenue from June 1 through June 30, excluding test and refunded orders, grouped by marketing channel | Defines the metric, dates, exclusions, and grouping |
| Which campaign was best? | Rank campaigns with at least $2,000 in spend by return on ad spend; show spend, attributed revenue, and order count | Defines best and prevents tiny campaigns from dominating |
| Show active users | Count distinct users with at least one completed session in the last 28 days, grouped by subscription plan | Defines active, removes duplicates, and requests a breakdown |
| Make a customer chart | Create a monthly line chart of new paying customers for the past 12 complete months; use the first successful payment date | Specifies the event, period, chart, and date field |
Ask the tool to explain each join, filter, calculation, and assumption in plain language. Ask it to:
- Show the number of rows before and after each join
- List records excluded by the status filter
- Compare the total with the approved finance metric
- Add a small sample of source records used in the calculation
These requests make the tool’s reasoning visible and testable.
From text-to-SQL to AI data visualization: four examples
A visualization should answer the question faster than a table. AI can suggest a chart but needs context to judge its accuracy.
-
Marketing campaign review: Join daily advertising spend to attributed orders, calculate return on ad spend, and display campaigns as horizontal bars. Keep spend and revenue in the table, and validate the five largest campaigns against the advertising platform before changing budgets.
-
Website conversion funnel: Count unique sessions reaching the landing page, product page, checkout, and purchase. Present a funnel chart, but audit counts and step-to-step percentages in a table. Check for users entering at later stages.
-
IT capacity monitoring: Plot daily 95th-percentile CPU by service as a line chart with the alert threshold. Averages alone can hide short periods of high load.
-
Customer retention analysis: Group customers by the month of their first payment and calculate the percentage returning in later months. A cohort heatmap reveals changes hidden by one churn number. Verify treatment of upgrades, pauses, refunds, and reactivations.
Use bars for categories, lines for changes over time, and tables for exact values or record-level review. Avoid 3D charts and crowded dashboards that obscure errors.
Checking accuracy, privacy, and database access
Text-to-SQL remains difficult on company databases. The Spider 2.0 research paper evaluated 632 enterprise-style tasks, often involving databases with more than 1,000 columns. Its o1-preview-based agent framework solved 17.0% of the tasks, compared with 91.2% on the original Spider benchmark and 73.0% on BIRD. The study does not score the commercial tools above, but warns that simple demonstrations do not establish reliability on complex schemas.
Review AI-generated results before sharing:
| Item | What to check | Why it matters |
|---|---|---|
| Business definition | Metric formula, exclusions, currency, and time zone | Two correct queries can answer different versions of the same question |
| Tables and joins | Join fields, relationship direction, and row counts | One-to-many joins can silently duplicate revenue or users |
| Date logic | Date field, boundaries, complete periods, and time zone | Relative phrases such as last month are easy to misread |
| Missing data | NULL handling, late records, and deleted records |
Missing values can change averages and rates |
| Result test | Sample rows and comparison with a trusted report | A plausible total is not evidence that the query is correct |
| Query cost | Date filters, selected columns, and scanned data | An unrestricted query can be slow and expensive |
Use read-only credentials limited to necessary data. This follows the least privilege principle described in NIST SP 800-53 control AC-6. Before enabling an external AI provider, identify which schema details, results, prompts, and feedback leave your environment. Mask personal data analysts do not need.
Common problems and a practical pilot scorecard
AI analyst tools often expose old data problems through a new interface: unclear definitions, duplicates, and uncontrolled access. Natural-language tools can expose those problems to more people.
Watch for:
- Correct SQL, wrong business meaning: The query uses gross revenue instead of required net revenue.
- Plausible invented fields: The assistant cites a nonexistent column or table.
- Duplicate rows after joins: Totals increase because the join changes the detail level.
- Partial-period comparisons: An incomplete week is compared with a complete week.
- Pretty but misleading charts: A truncated axis or unsuitable chart exaggerates a small change.
- No route for correction: Users cannot report errors or find the metric owner.
Measure a four-week pilot against explicit targets. These are internal goals, not industry benchmarks:
| Measure | Suggested starting target | How to measure it |
|---|---|---|
| Answer accuracy | At least 90% on approved test questions | Compare results with reviewed answers |
| Safe execution | 100% of pilot queries use read-only access | Review database roles and query logs |
| Time saved | 30% lower median time to a checked answer | Compare similar tasks before and during the pilot |
| Correction rate | Fewer than 10% of published results need revision | Track edits and error reports |
| User understanding | Every published result has a named metric and date range | Review saved charts and dashboards |
Do analysts still need SQL? Yes, though they can learn gradually. Knowing filters, joins, grouping, and row counts catches many mistakes. Can marketing users avoid writing SQL? Often, with prepared datasets and metrics. Should AI connect directly to production? Usually not; use a narrowly permissioned read replica or analytics warehouse.
Choosing AI analyst tools for your first data project
Data analyst SQL tools help marketing and IT professionals explore databases while learning SQL. Strong workflows combine plain-language requests, visible SQL, prepared metrics, read-only access, and human review. Without one, a fast answer can become a fast mistake.
For a manageable first project:
- Choose a recurring question with a trusted answer.
- Test two AI analyst tools against 20 to 30 realistic prompts.
- Publish only reviewed queries and visualizations.
Good analyst SQL requires understanding data connections and metric meanings more than memorizing syntax. Start small, keep queries visible, and compare important results with source records. This makes query tools dependable rather than merely impressive.
Frequently Asked Questions
Do analysts still need SQL when using AI analyst tools?
Yes, although they can learn it gradually. Understanding filters, joins, grouping, date logic, and row counts helps analysts recognize queries that are technically valid but produce misleading results.
Should an AI analyst tool connect directly to a production database?
Usually not. Use a read-only analytics warehouse, prepared dataset, or narrowly permissioned read replica so the tool cannot alter operational data or access unnecessary schemas.
How can I verify that AI-generated SQL is accurate?
Check the tables, joins, metric definitions, date boundaries, exclusions, and handling of missing values. Compare the result with a trusted report and inspect sample source records, especially before using it for budgets or operational decisions.
What information should I include in a text-to-SQL prompt?
Specify the metric, population, time range, grouping, exclusions, and desired output. Ask the tool to explain its joins, filters, calculations, and assumptions so you can review how it interpreted the request.
What causes AI-generated totals to be unexpectedly high?
A one-to-many join may duplicate orders, customers, or revenue across multiple rows. Compare row counts before and after each join, confirm the intended level of detail, and aggregate or deduplicate records where necessary.
How should a team choose its first AI analyst tool?
Start with tools that fit the existing database, BI platform, permissions, and metric definitions. Test two candidates against 20 to 30 realistic questions, including awkward wording, joins, missing data, and time comparisons.
Which chart should I use for AI-generated query results?
Use bars to compare categories, lines to show changes over time, and tables when exact values or source-level inspection matter. Treat AI chart suggestions as drafts and check axes, aggregation, incomplete periods, and whether the chart could exaggerate differences.
Related Articles
How to Implement AI-Powered Self-Service Analytics
Implement AI-powered self-service analytics with governed data, secure access, user training, rigorous testing, and measurable pilot goals.
Text-to-SQL for Product Managers: A Practical Guide
Learn how product managers can use text-to-SQL for safe, reliable self-service analytics, from metric definitions to result verification.
No-Code Data Access: AI Query Tools for Analysts
Learn how AI query tools simplify database reporting, why basic SQL still matters, and how analysts can verify results and roll out access safely.